
11.1 RAGF Cloud Vision
11.2 Developer Governance Dashboard
11.3 Organization Governance Dashboard
11.4 AI Agent Monitoring Dashboard
11.5 Robot Monitoring Dashboard
11.6 Continuous Monitoring Engine
11.7 Alerts, Reports, and Recommendations
Part IV — RAGF Implementation and Ecosystem
Chapter 11: RAGF Technology Platform
11.1 RAGF Cloud Vision
The RAGF Cloud is the technology backbone of the Righteous AI Governance Framework. It transforms the theoretical principles of RAGF into a practical, scalable, and continuously operating governance system that monitors, measures, and manages AI righteousness across the full AI lifecycle.
The Vision
The RAGF Cloud is designed to provide:
- Unified Governance — A single platform for governing all AI systems, from development to deployment to autonomous operation
- Continuous Monitoring — Real-time oversight of AI behavior across organizations, agents, and robots
- Actionable Intelligence — Alerts, reports, and recommendations that enable proactive governance
- Scalable Infrastructure — Support for enterprises of all sizes, from small teams to global organizations
Core Principles
Table 1 — RAGF Cloud Core Principles
| Principle | Description |
|---|---|
| Real-Time Visibility | Governance data is available in real time, not just in periodic reports |
| Proactive Protection | The platform identifies and alerts on issues before they escalate |
| Integrated Workflows | Governance is embedded into existing development and operational workflows |
| Audit Readiness | All governance activities are logged and traceable for compliance and audit |
| Continuous Improvement | The platform evolves with new capabilities, threats, and regulatory requirements |
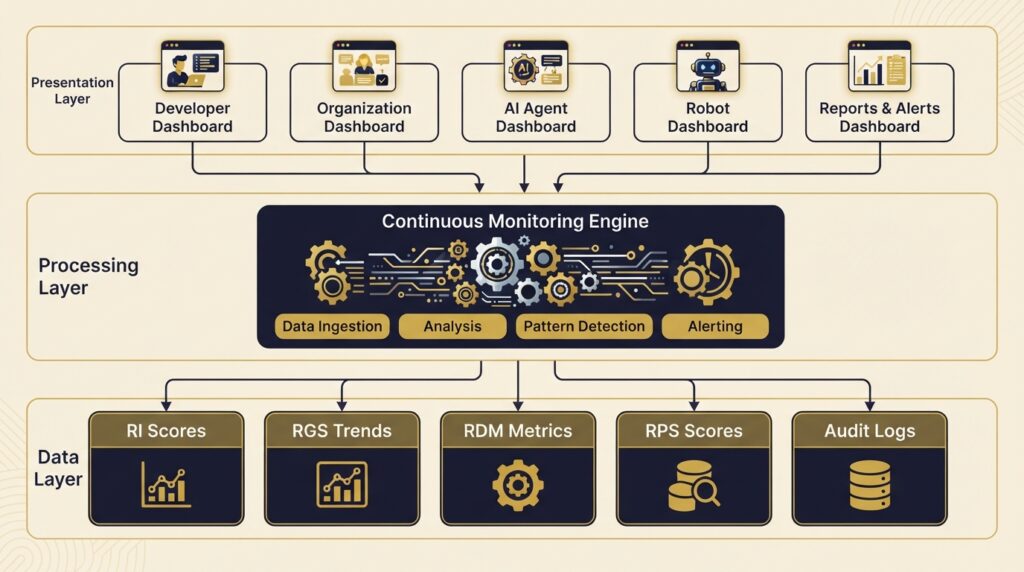
Figure 1 — RAGF Cloud Architecture
This figure illustrates the three-layer architecture of the RAGF Cloud platform — Presentation Layer (dashboards), Processing Layer (Continuous Monitoring Engine), and Data Layer (scores, metrics, logs).
11.2 Developer Governance Dashboard
The Developer Governance Dashboard provides AI developers, engineers, and data scientists with visibility into the righteousness of their development practices. It enables teams to identify and address righteousness issues early in the development lifecycle.
Purpose
Table 2 — Developer Governance Dashboard Purpose
| Purpose | Description |
|---|---|
| Track RI-D Scores | Monitor the Righteousness Index for Development practices |
| Identify Issues Early | Detect righteousness issues before deployment |
| Guide Improvement | Provide actionable feedback to development teams |
| Enable Self-Assessment | Empower developers to assess their own practices |
Dashboard Components
This table outlines the key components of the Developer Governance Dashboard, including their descriptions and metrics.
Table 3 — Developer Governance Dashboard Components
| Component | Description | Key Metrics |
|---|---|---|
| RI-D Score | Overall righteousness score for development practices | RI-D Score (0–100) |
| Pillar Breakdown | Scores for each of the Five Pillars | Integrity, Justice, Stewardship, Wisdom, Beneficence scores |
| Practice Status | Status of key development practices | Compliance status, completion rates |
| Issue Tracker | Identified righteousness issues | Issue count, severity, status |
| Improvement Trends | Changes in scores over time | RGS-D trends |
| Recommendations | Actionable improvement suggestions | Priority, owner, timeline |
Key Metrics
Table Description: This table outlines the key metrics displayed on the Developer Governance Dashboard.
Table 4 — Developer Governance Key Metrics
| Metric | Description | Target |
|---|---|---|
| Overall RI-D Score | Composite score for development righteousness | ≥80 for “Righteous” rating |
| Pillar Scores | Scores for Integrity, Justice, Stewardship, Wisdom, Beneficence | ≥80 for each pillar |
| Bias Test Coverage | Percentage of models with bias tests conducted | ≥90% |
| Documentation Completeness | Percentage of projects with complete righteousness documentation | ≥85% |
| Issue Resolution Rate | Percentage of identified issues resolved within timeframe | ≥90% |
Key Insight: The Developer Governance Dashboard transforms abstract righteousness principles into concrete, actionable metrics that development teams can understand and act upon.
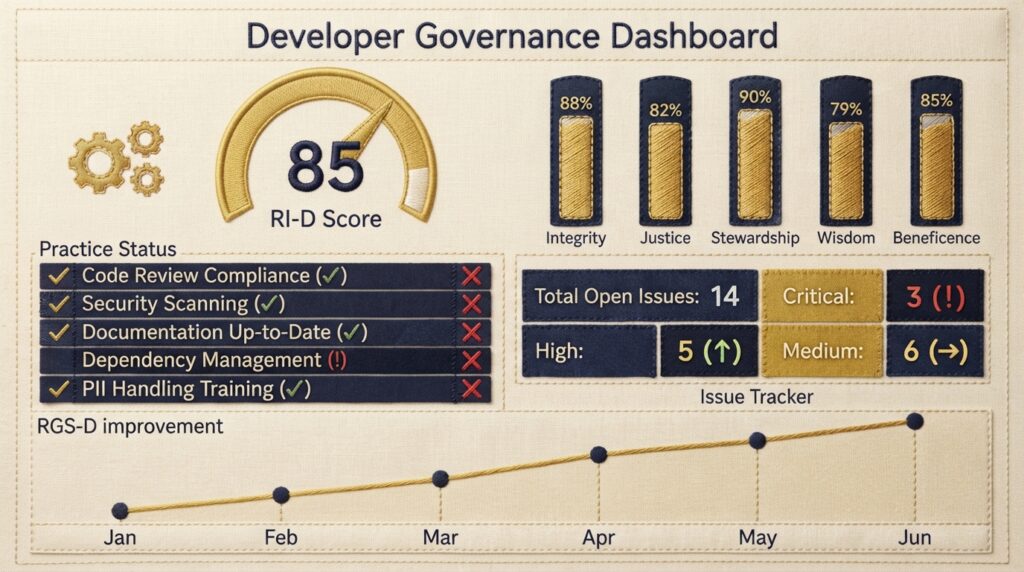
Figure 2 — Developer Governance Dashboard Concept
Figure Description: This figure presents a concept visualization of the Developer Governance Dashboard, showing RI-D Score, pillar breakdowns, practice status, issue tracker, and improvement trends.
11.3 Organization Governance Dashboard
The Organization Governance Dashboard provides executives, compliance officers, and AI governance leads with a comprehensive view of AI righteousness across the entire organization.
Purpose
Table 5 — Organization Governance Dashboard Purpose
| Purpose | Description |
|---|---|
| Track RI-O Scores | Monitor the Righteousness Index for Organizational Governance |
| Provide Executive Visibility | Enable leadership oversight of AI governance |
| Identify Systemic Issues | Detect patterns and trends across the organization |
| Demonstrate Accountability | Provide evidence of governance effectiveness |
Dashboard Components
Table 6 — Organization Governance Dashboard Components
| Component | Description | Key Metrics |
|---|---|---|
| RI-O Score | Overall righteousness score for organizational governance | RI-O Score (0–100) |
| Pillar Breakdown | Scores for each of the Five Pillars | Integrity, Justice, Stewardship, Wisdom, Beneficence scores |
| System Inventory | Status of AI systems across the organization | Number of systems, risk levels, compliance status |
| Policy Compliance | Compliance with AI governance policies | Compliance rate, exceptions |
| Incident Summary | Summary of AI righteousness incidents | Incident count, severity, resolution status |
| RGS-O Trend | Organizational governance improvement over time | RGS-O trend |
Key Metrics
This table outlines the key metrics displayed on the Organization Governance Dashboard.
Table 7 — Organization Governance Key Metrics
| Metric | Description | Target |
|---|---|---|
| Overall RI-O Score | Composite score for organizational governance | ≥80 for “Righteous” rating |
| Pillar Scores | Scores for Integrity, Justice, Stewardship, Wisdom, Beneficence | ≥80 for each pillar |
| AI System Coverage | Percentage of AI systems under governance | ≥95% |
| Policy Compliance Rate | Percentage of policies being followed | ≥90% |
| Incident Resolution Time | Average time to resolve incidents | ≤30 days |
Key Insight: The Organization Governance Dashboard enables leadership to govern at scale — providing visibility into AI governance across the entire enterprise.
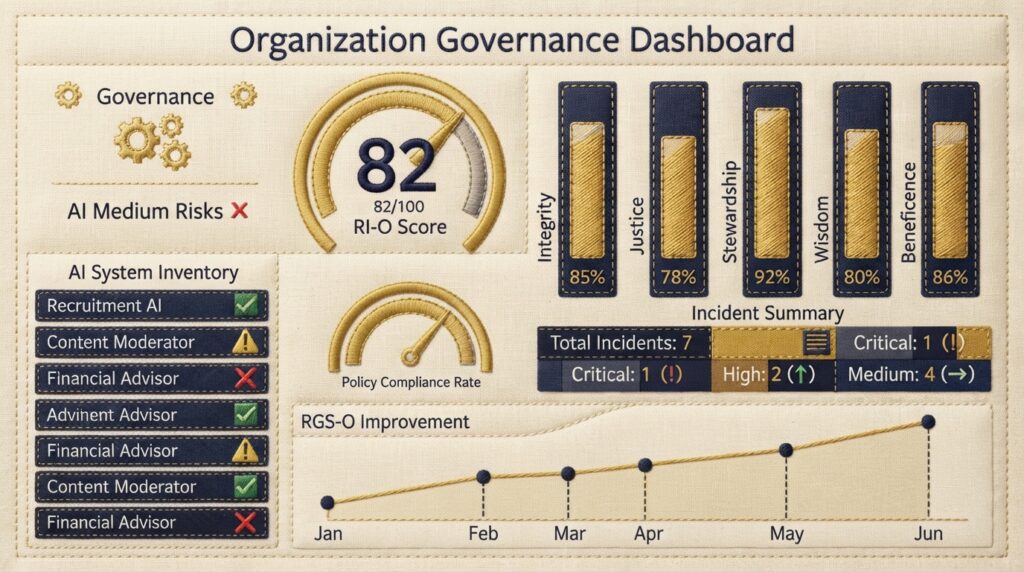
Figure 3 — Organization Governance Dashboard Concept
This figure presents a concept visualization of the Organization Governance Dashboard, showing RI-O Score, pillar breakdowns, system inventory, policy compliance, incident summary, and RGS-O trend.
11.4 AI Agent Monitoring Dashboard
The AI Agent Monitoring Dashboard provides real-time visibility into the behavior of autonomous AI agents. It enables organizations to detect and respond to unrighteous behavior before it causes harm.
Purpose
Table 8 — AI Agent Monitoring Dashboard Purpose
| Purpose | Description |
|---|---|
| Track RI-A Scores | Monitor the Righteousness Index for AI Agents |
| Detect Anomalies | Identify unusual or unrighteous behavior patterns |
| Enable Rapid Response | Provide alerts for immediate intervention |
| Support Investigation | Enable forensic analysis of agent behavior |
Dashboard Components
This table outlines the key components of the AI Agent Monitoring Dashboard, including their descriptions and metrics.
Table 9 — AI Agent Monitoring Dashboard Components
| Component | Description | Key Metrics |
|---|---|---|
| RI-A Score | Overall righteousness score for AI agents | RI-A Score (0–100) |
| Agent Inventory | Status of all monitored AI agents | Number of agents, status, risk levels |
| Behavioral Alerts | Real-time alerts for unrighteous behavior | Alert count, severity, response status |
| Decision Quality | Quality of agent decisions | RDM scores, decision patterns |
| Anomaly Detection | Identification of unusual patterns | Anomaly count, type, severity |
| RI-A Trend | Agent righteousness improvement over time | RGS-A trend |
Key Metrics
This table outlines the key metrics displayed on the AI Agent Monitoring Dashboard.
Table 10 — AI Agent Monitoring Key Metrics
| Metric | Description | Target |
|---|---|---|
| Overall RI-A Score | Composite score for AI agent righteousness | ≥80 for “Righteous” rating |
| Deception Detection | Number of detected deception attempts | Minimal (<5 per month) |
| Social Engineering Attempts | Number of detected social engineering attempts | Zero |
| Action Boundary Compliance | Percentage of actions within authorized boundaries | ≥99% |
| Alert Response Time | Average time to respond to alerts | ≤15 minutes |
AI Agent Monitoring Dashboard Concept
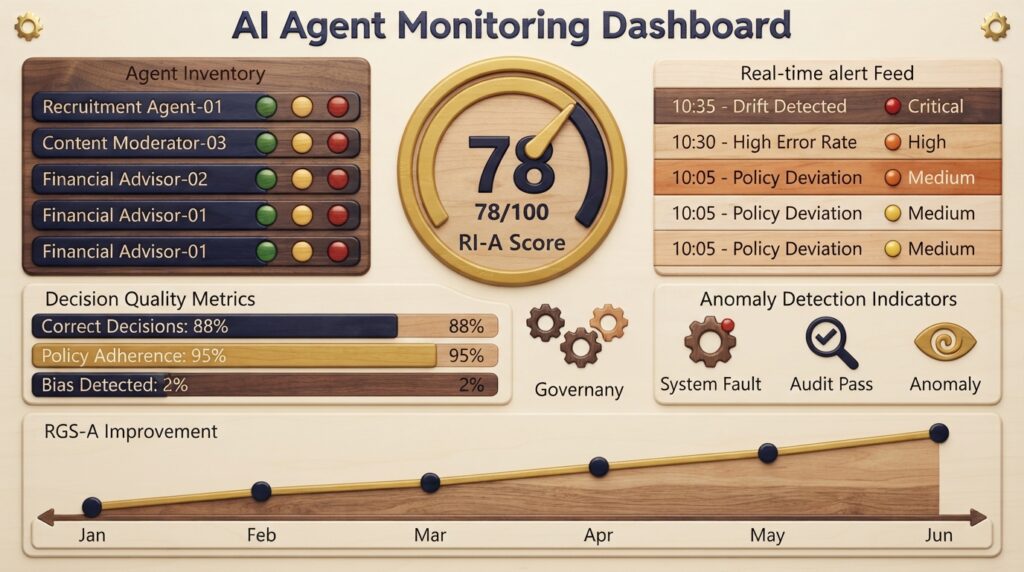
Figure 4 — AI Agent Monitoring Dashboard Concept
Figure Description: This figure presents a concept visualization of the AI Agent Monitoring Dashboard, showing RI-A Score, agent inventory, behavioral alerts, decision quality, anomaly detection, and RI-A trend.
11.5 User Governance Dashboard
The User Governance Dashboard provides individual users, employees, and professionals with visibility into their own AI usage righteousness. It enables users to assess their AI usage practices, identify areas for improvement, and track their growth in righteous AI use.
Purpose
Table 11 — User Governance Dashboard Purpose
| Purpose | Description |
|---|---|
| Track RI-U Scores | Monitor the Righteousness Index for User AI usage |
| Self-Assessment | Empower users to evaluate their own AI usage practices |
| Identify Improvement Areas | Detect unrighteous usage patterns |
| Track Progress | Measure improvement in righteous AI usage over time |
Dashboard Components
Table 12 — User Governance Dashboard Components
| Component | Description | Key Metrics |
|---|---|---|
| RI-U Score | Overall righteousness score for user AI usage | RI-U Score (0–100) |
| Pillar Breakdown | Scores for each of the Five Pillars | Integrity, Justice, Stewardship, Wisdom, Beneficence scores |
| Usage Transparency | Disclosure of AI usage in work/study | Disclosure rate, transparency score |
| Verification Rate | Frequency of verifying AI outputs | Verification percentage |
| Prudent Use | Appropriate use of AI (knowing when not to use AI) | Prudent use score |
| RI-U Trend | User righteousness improvement over time | RGS-U trend |
Key Metrics
Table 13 — User Governance Key Metrics
| Metric | Description | Target |
|---|---|---|
| Overall RI-U Score | Composite score for user AI usage righteousness | ≥80 for “Righteous” rating |
| AI Usage Disclosure Rate | Percentage of AI usage properly disclosed | ≥95% |
| Output Verification Rate | Percentage of AI outputs verified before use | ≥90% |
| Prudent AI Use Score | Appropriate use of AI (knowing when not to use AI) | ≥80 |
| Improvement Trend | RGS-U positive trend | Positive RGS-U |
Key Insight: The User Governance Dashboard empowers individuals to take responsibility for their own AI usage righteousness, complementing organizational governance with personal accountability.
11.6 Robot Monitoring Dashboard
The Robot Monitoring Dashboard provides real-time visibility into the behavior of embodied AI systems — robots, autonomous vehicles, drones, and other physical AI systems.
Purpose
Table 14 — Robot Monitoring Dashboard Purpose
| Purpose | Description |
|---|---|
| Track RI-R Scores | Monitor the Righteousness Index for Robots |
| Ensure Physical Safety | Monitor for safety violations and physical risks |
| Protect Human Dignity | Detect violations of human dignity |
| Enable Rapid Response | Provide alerts for immediate intervention |
Dashboard Components
Table Description: This table outlines the key components of the Robot Monitoring Dashboard, including their descriptions and metrics.
Table 15 — Robot Monitoring Dashboard Components
| Component | Description | Key Metrics |
|---|---|---|
| RI-R Score | Overall righteousness score for robots | RI-R Score (0–100) |
| Robot Inventory | Status of all monitored robots | Number of robots, status, locations |
| Safety Alerts | Real-time alerts for safety violations | Alert count, severity, response status |
| Behavioral Monitoring | Monitoring of robot behavior | Behavioral patterns, anomalies |
| Physical Interaction | Quality of human-robot interaction | Interaction metrics, incident reports |
| RI-R Trend | Robot righteousness improvement over time | RGS-R trend |
Key Metrics
This table outlines the key metrics displayed on the Robot Monitoring Dashboard.
Table 16 — Robot Monitoring Key Metrics
| Metric | Description | Target |
|---|---|---|
| Overall RI-R Score | Composite score for robot righteousness | ≥80 for “Righteous” rating |
| Safety Incident Rate | Number of safety incidents per robot | Zero |
| Dignity Violations | Number of detected dignity violations | Zero |
| Human Oversight Coverage | Percentage of operations with human oversight | ≥95% |
| Alert Response Time | Average time to respond to alerts | ≤5 minutes |
Robot Monitoring Dashboard Concept
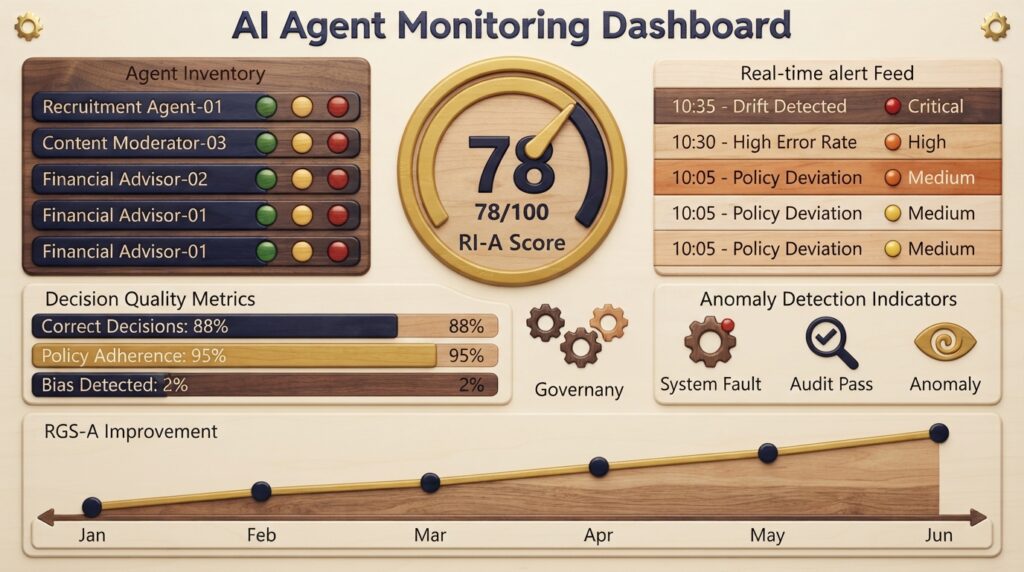
Figure 5 — Robot Monitoring Dashboard Concept
This figure presents a concept visualization of the Robot Monitoring Dashboard, showing RI-R Score, robot inventory, safety alerts, behavioral monitoring, physical interaction, and RI-R trend.
11.7 Continuous Monitoring Engine
The Continuous Monitoring Engine is the core processing component of the RAGF Cloud. It ingests data from all sources, analyzes it against righteousness standards, and generates alerts, reports, and recommendations.
Core Functions
Table 17 — Continuous Monitoring Core Functions
| Function | Description |
|---|---|
| Data Ingestion | Collect data from AI systems, agents, robots, and development practices |
| Real-Time Analysis | Analyze data against RAGF standards in real time |
| Pattern Detection | Identify patterns and anomalies that indicate righteousness issues |
| Alert Generation | Generate alerts for detected issues |
| Report Generation | Generate periodic and on-demand reports |
| Recommendation Generation | Generate actionable improvement recommendations |
Monitoring Capabilities
Continuous Monitoring Capabilities
This table outlines the key capabilities of the Continuous Monitoring Engine, including their descriptions and implementation approaches.
Table 18 — Continuous Monitoring Capabilities
| Capability | Description | Implementation |
|---|---|---|
| Behavioral Monitoring | Monitor AI agent and robot behavior | Real-time telemetry, action logging |
| Performance Monitoring | Monitor AI system performance | Accuracy metrics, bias detection, error rates |
| Compliance Monitoring | Monitor governance policy compliance | Policy checks, audit trails, compliance dashboards |
| Anomaly Detection | Detect unusual or suspicious patterns | ML-based anomaly detection, rule-based alerts |
| Drift Detection | Detect when AI behavior drifts from standards | Statistical analysis, baseline comparison |
| Incident Detection | Detect and alert on incidents | Incident detection rules, real-time alerting |
Data Sources
Table Description: This table outlines the key data sources for the Continuous Monitoring Engine, including the data types collected.
Table 19 — Continuous Monitoring Data Sources
| Source | Data Type | Collection Method |
|---|---|---|
| AI Systems | Performance metrics, outputs, logs | API integration, log collection |
| AI Agents | Decisions, actions, communications | Telemetry, action logging |
| Robots | Physical actions, sensor data, interactions | Telemetry, sensor data collection |
| Development Practices | Code quality, bias tests, documentation | CI/CD integration, code analysis |
| Governance Activities | Policy compliance, audit findings | Governance system integration |
Key Insight: The Continuous Monitoring Engine enables organizations to move from periodic assessments to real-time governance — detecting and responding to issues as they occur rather than after the fact.
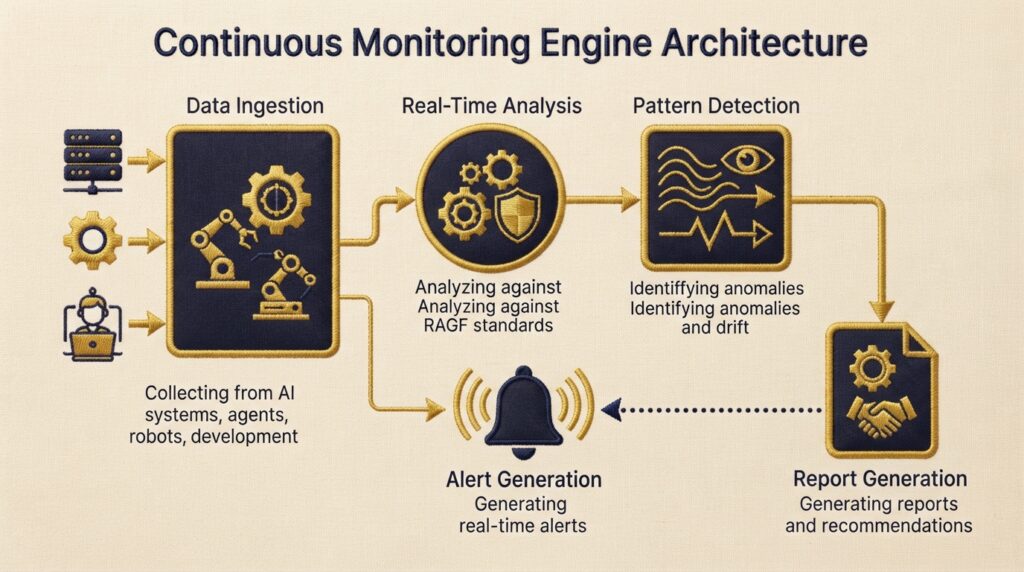
Figure 6 — Continuous Monitoring Engine Architecture
Figure Description: This figure illustrates the architecture of the Continuous Monitoring Engine, showing data ingestion, analysis, pattern detection, alerting, and reporting.
11.8 Alerts, Reports, and Recommendations
The RAGF Cloud provides a comprehensive suite of alerts, reports, and recommendations to support proactive AI governance.
Alert System
The alert system provides real-time notifications for righteousness issues:
Table 20 — RAGF Alert Types
| Alert Type | Description | Priority |
|---|---|---|
| Critical | Immediate action required — active righteousness violation | Highest |
| High | Urgent attention needed — high risk of violation | High |
| Medium | Action recommended — potential risk developing | Medium |
| Low | Informational — issue to monitor | Low |
Alert Channels
Table 21 — RAGF Alert Channels
| Channel | Description | Use Case |
|---|---|---|
| Dashboard | In-platform alerts | Real-time monitoring |
| Email notifications | Non-urgent notifications | |
| SMS | Text message alerts | Critical alerts |
| Slack/Teams | Messaging platform alerts | Team notifications |
| API | Programmatic alerts | System integration |
Report Types
Table Description: This table outlines the key report types available in the RAGF Cloud platform, including their descriptions and audiences.
Table 22 — RAGF Report Types
| Report Type | Description | Audience | Frequency |
|---|---|---|---|
| RI Score Report | Current RI scores across all dimensions | Executives, governance teams | Monthly |
| RGS Trend Report | Improvement trends over time | Governance teams, leadership | Quarterly |
| Pillar Report | Detailed analysis by pillar | Governance teams, developers | Monthly |
| Incident Report | Summary of righteousness incidents | Executives, governance teams | As needed |
| Audit Report | Governance audit findings | Compliance teams, auditors | Annual |
| Compliance Report | Policy compliance status | Governance teams, compliance | Monthly |
| Recommendation Report | Actionable improvement recommendations | All stakeholders | Monthly |
Recommendation Types
Table Description: This table outlines the key recommendation types available in the RAGF Cloud platform, including their descriptions and examples.
Table 23 — RAGF Recommendation Types
| Recommendation Type | Description | Examples |
|---|---|---|
| Improvement | Actions to improve righteousness scores | “Implement bias testing for all models” |
| Corrective | Actions to address identified issues | “Update data governance policy to include fairness requirements” |
| Preventive | Actions to prevent future issues | “Establish regular ethical reflection sessions” |
| Governance | Actions to improve governance structures | “Create an AI ethics committee” |
| Technical | Actions to implement technical safeguards | “Deploy action boundary enforcement for AI agents” |
Recommendation Workflow
Table 24 — RAGF Recommendation Workflow
| Step | Activity | Owner |
|---|---|---|
| 1 | Identify Issue | Continuous Monitoring Engine detects issue |
| 2 | Generate Recommendation | System generates recommendation |
| 3 | Review | Governance team reviews recommendation |
| 4 | Assign | Recommendation assigned to owner |
| 5 | Implement | Owner implements recommendation |
| 6 | Verify | System verifies implementation |
| 7 | Close | Recommendation closed |
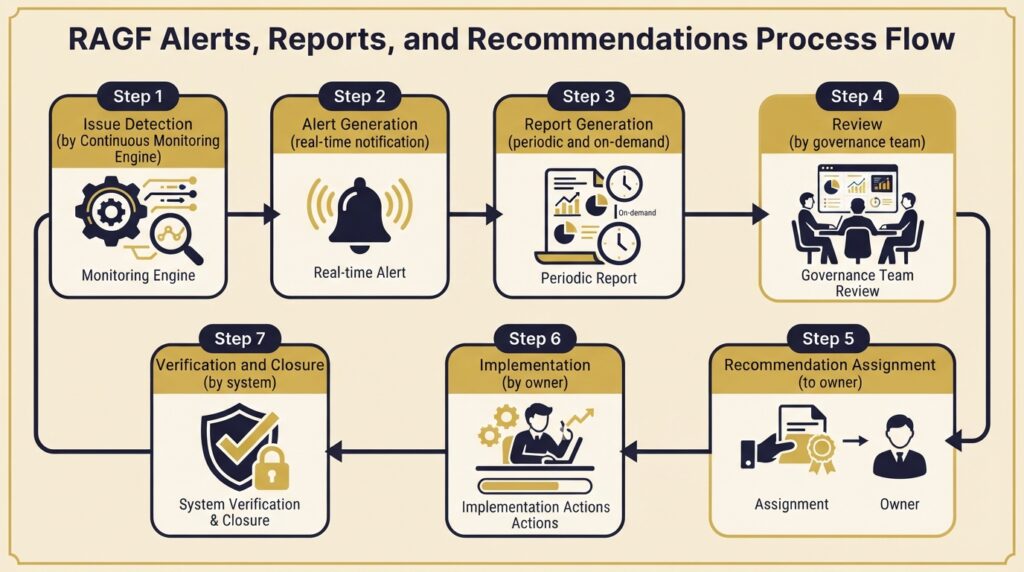
Figure 7 — Alerts, Reports, and Recommendations Workflow
This figure illustrates the workflow for alerts, reports, and recommendations in the RAGF Cloud platform, from issue detection to resolution.
References
Boomi. (2025). Advancing AI agent governance with Boomi and AWS. https://boomi.com
Collibra. (2026). AI Command Center: Turn AI activity into measurable business oversight. https://www.collibra.com
Credo AI. (n.d.). The trusted leader in AI governance. https://www.credo.ai
IBM. (2025). Revolutionizing AI agent management with watsonx Orchestrate’s observability and governance capabilities. https://www.ibm.com
Naaia. (2026). Continuous AI governance – Always audit-ready. https://naaia.ai
Nemko Digital. (2026). Continuous AI monitoring for stronger governance. https://digital.nemko.com
SAS Institute. (2026). SAS AI Navigator: AI governance at scale. https://www.sas.com
Timeplus. (2026). AgentGuard: Real-time security monitoring for AI agent fleets. https://docs.timeplus.com